
1 Introduction
Indonesian batik is widely recognized as an intangible cultural heritage whose motifs encode regional identity, historical narratives, and symbolic meaning, and whose preservation increasingly depends on digital documentation and public accessibility [1]. Recent work in batik informatics argues that computational recognition systems can support curation, education, and tourism by helping non-experts identify motifs that would otherwise require specialist knowledge [2]. In particular, automatic batik pattern classification has been proposed as a way to bridge the gap between expert artisans and broader audiences, enabling applications such as museum search interfaces, digital archives, and mobile guides for on-site cultural exploration [3]. From a computer-vision perspective, batik recognition is a fine-grained multi-class classification problem over texture-rich patterns. Existing batik datasets are predominantly small, local, and motif-specific, such as Semarang-region corpora of 3,000 images across 10 classes or mobile datasets of 1,350 images spanning 15 pattern categories [3] [2]. Early studies relying on handcrafted color, texture, and shape features combined with shallow classifiers reported very high accuracies under cross-validation, sometimes exceeding 99% [3]. Subsequent work with transfer-learned convolutional neural networks (CNNs) has even reported perfect test accuracy for several ImageNet-pretrained backbones on the same Semarang dataset [1]. However, these results are bound to specific, limited protocols and do not yet reveal which modern architectures generalize best across diverse batik motifs, imaging conditions, and deployment constraints. The underlying visual problem is challenging because batik classes often differ only in subtle local cues—small changes in ornament placement, stroke style, or motif composition—while exhibiting large intra-class variation in color palettes, fabric folds, and degradation [3]. Fine-grained recognition research consistently characterizes this combination of small inter-class differences and large intra-class variability as a core obstacle to robust classification [4] [5]. Studies on related texture-heavy or heritage-like domains further show that illumination shifts, scale and orientation changes, background clutter, and repetitive structures can obscure discriminative details and degrade performance [6] [7]. Successful fine-grained models therefore tend to incorporate mechanisms that emphasize salient local regions, strengthen class separability, or combine multi-region evidence rather than relying on a single global representation [8] [9] [10]. Against this backdrop, there is growing interest in whether modernized CNNs or Transformer-based models provide better inductive biases for fine-grained tasks in limited-data regimes. ConvNeXt has been introduced as a convolutional architecture that incorporates several design elements popularized by Vision Transformers while retaining locality, weight sharing, and hardware efficiency [11]. Empirical studies report that ConvNeXt can serve as a strong baseline or outperform older CNNs on standard fine-grained benchmarks, and that its variants adapt well to heritage-like texture classification when combined with frequency-guided modules [8] [10]. In contrast, Vision Transformers (ViTs) offer powerful global self-attention mechanisms that capture long-range dependencies across image patches, and have achieved competitive or superior performance in large-scale vision tasks [9] [12]. Yet several analyses note that ViTs often require more data, computation, or additional inductive bias to converge reliably on smaller datasets, and that hybrid CNN–ViT designs can improve training stability and accuracy in such settings [9] [13] [12]. Despite these developments, batik-specific studies have so far compared CNNs only against handcrafted-feature pipelines or other CNN backbones, without systematically evaluating Transformer-based architectures under a unified training and evaluation protocol [3] [1]. At the same time, the most informative ConvNeXt–ViT comparisons come from proxy domains such as general fine-grained object recognition, remote sensing, and mural or stone-relief analysis rather than from batik itself [9] [10] [14]. This leaves an open empirical question: in small, texture-rich multi-class batik datasets, does recognition benefit more from the strong local modeling and efficiency of ConvNeXt or from the global context modeling of Transformers, or do both architectures behave similarly once transfer learning and preprocessing are aligned? This paper addresses that gap by framing Indonesian batik recognition explicitly as a fine-grained cultural-heritage classification task and by conducting a controlled comparison between ConvNeXt and Transformer-based models under matched preprocessing, transfer-learning strategies, and evaluation metrics. The proposed experimental setup evaluates multiple ConvNeXt and ViT variants on a multi-class batik dataset, examining overall accuracy, per-class behavior, and computational efficiency, with the aim of characterizing architectural trade-offs rather than introducing a new model. By grounding the study in both batik-cultural motivations and fine-grained recognition theory, and by providing batik-specific evidence on CNN–Transformer performance, the work seeks to clarify which inductive biases are currently most promising for practical batik recognition and to establish a reproducible baseline for future research on digital support for Indonesian textile heritage.
3 Methodology
3.1 Research Design and Experimental Framework
This study adopts a controlled comparative experimental design to evaluate the performance of three pretrained vision backbones—ConvNeXt-Tiny, ViT-B/16, and DINOv2 ViT-B/14—for multi-class Indonesian batik pattern recognition. The primary objective is to conduct an ablation-style comparison of frozen-backbone representations under an identical linear probing protocol, thereby isolating differences in feature quality rather than full adaptation capacity [27]. All three models are initialized from publicly available ImageNet-pretrained (ConvNeXt-Tiny, ViT-B/16) or large-scale self-supervised (DINOv2 ViT-B/14) checkpoints and used as fixed feature extractors. Only a newly added linear classification head is trained on top of each backbone, which constrains the trainable parameter budget and emphasizes representation transferability [28]. To ensure a fair comparison, the same Indonesian Batik dataset, preprocessing pipeline, stratified data partitions, and optimization hyperparameters are applied to all three architectures [29] [30]. The experimental workflow follows a linear seven-stage pipeline (Figure 1), comprising dataset preparation, preprocessing, stratified splitting, model-specific linear probing, evaluation, and comparative analysis. Each backbone receives identical 224 × 224 RGB inputs, normalized with ImageNet statistics, and each is trained with the same optimizer, learning rate, batch size, and stopping rule. Performance is compared using accuracy, macro-precision, macro-recall, and macro-F1-score, enabling architecture-level conclusions under a rigorously matched protocol [1] [27].
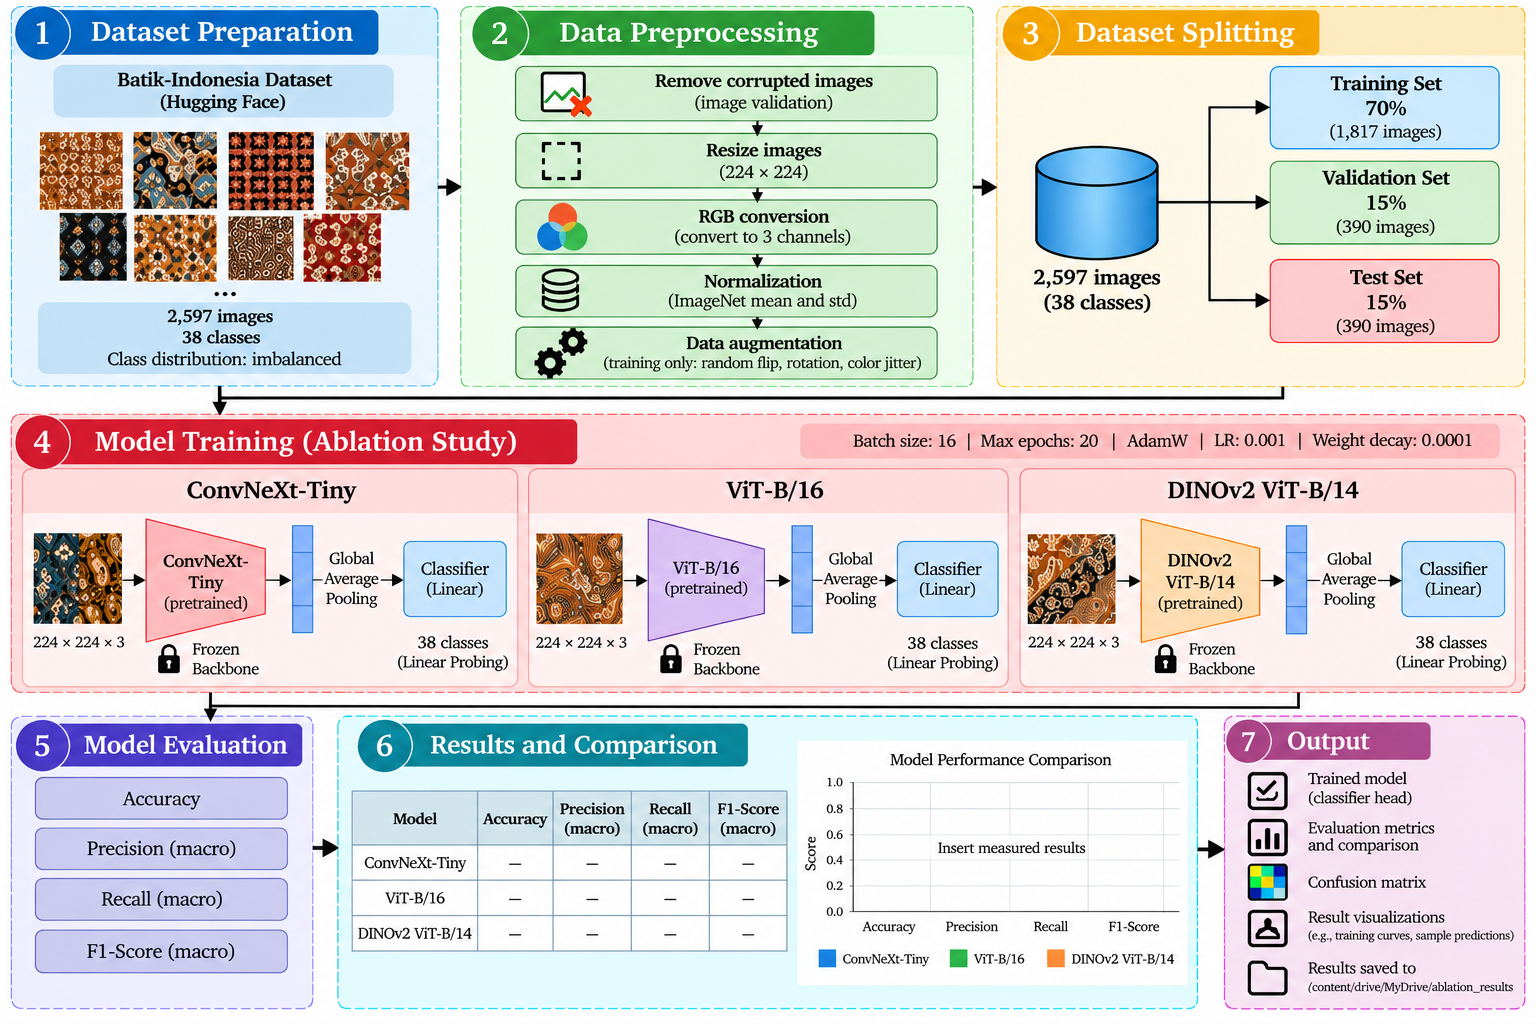
Flowchart of the seven-stage batik motif classification workflow: dataset preparation, preprocessing, stratified splitting, model-specific linear probing, evaluation and comparative analysis, applied identically to ConvNeXt-Tiny, ViT-B/16 and DINOv2 ViT-B/14.
The figure summarizes the modular flow from dataset acquisition and cleaning through preprocessing, split generation, model training, and metric-based comparison, highlighting the identical treatment of ConvNeXt-Tiny, ViT-B/16, and DINOv2 ViT-B/14 within the same linear probing framework. This visual emphasizes reproducibility and methodological parity across architectures.
3.2 Dataset Collection and Preprocessing
The experiments use the Indonesian Batik image dataset retrieved from the Hugging Face repository muhammadsalmanalfaridzi/Batik-Indonesia. Following dataset filtering and image validation, the final dataset consists of 2,597 valid images belonging to 38 batik motif classes. The dataset represents diverse Indonesian batik patterns characterized by variations in color, texture, and shape, making it suitable for evaluating fine-grained multi-class image classification [3], [31]. Unlike a balanced dataset, the collected images exhibit an imbalanced class distribution, with the number of samples per class ranging from 22 to 230. Before model training, all images undergo an integrity check to identify and remove corrupted or unreadable files, as data quality can affect the reliability of image classification models [3], [32]. Only images that pass this validation procedure are retained for subsequent experiments.
Each valid image is resized to pixels, converted to three-channel RGB format, and normalized using the standard ImageNet mean and standard deviation to ensure compatibility with the pretrained encoders [1], [33]. Pixel-wise normalization is expressed as
| (1) |
where denotes the original RGB pixel intensity, represents the ImageNet channel-wise mean, denotes the corresponding standard deviation, and is the normalized pixel value. This transformation provides a consistent input scale across color channels while retaining potentially discriminative color and texture information for batik motif recognition [34], [32]. During training, data augmentation is applied exclusively to the training subset. The augmentation strategy includes random horizontal flipping and small-angle rotation, with color jitter also considered when implemented in the experimental pipeline. These transformations are intended to improve model generalization while ensuring that validation and test images remain unaffected by training-time augmentation, thereby reducing the risk of data leakage [1], [34].
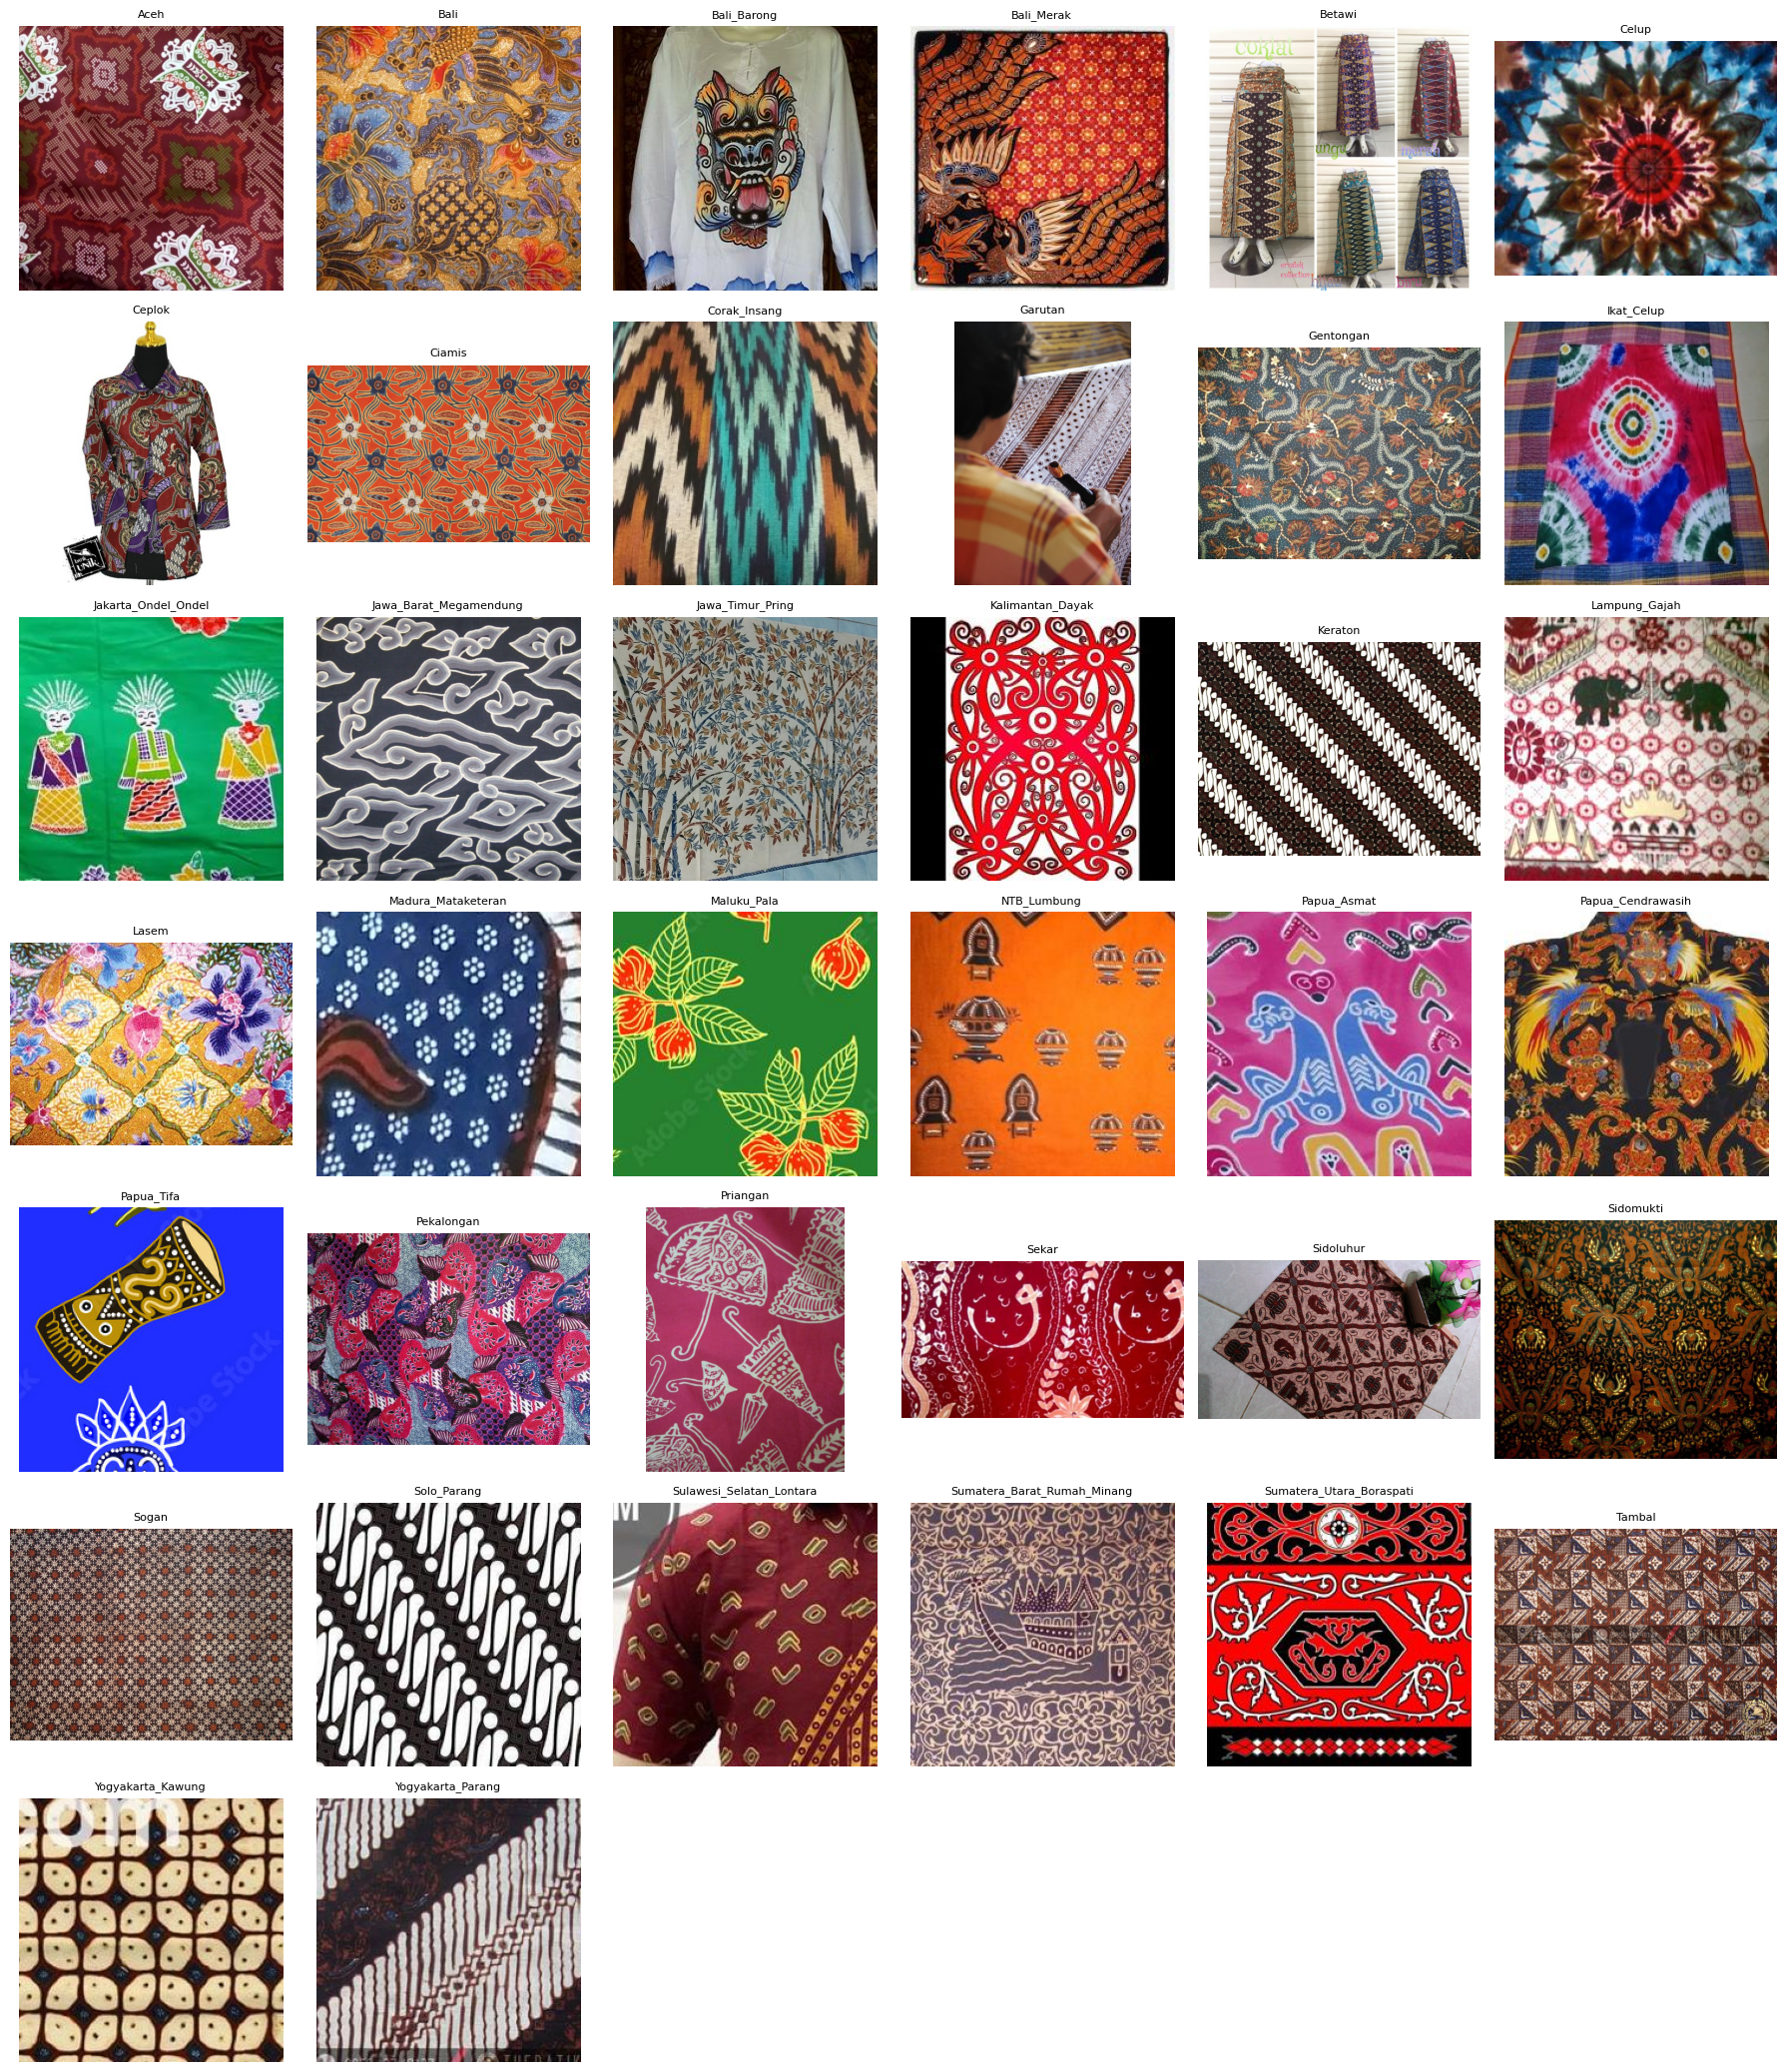
Grid of representative images of the 38 Indonesian batik motif classes in the dataset, showing the range of patterns, colours and textures across classes.
3.3 Dataset Partitioning and Experimental Setup
The filtered dataset of 2,597 images is partitioned into training, validation, and test subsets using a stratified split ratio of 70%, 15%, and 15%, respectively. The resulting subsets contain 1,817 training images, 390 validation images, and 390 test images. Stratified partitioning is employed to maintain class representation across the subsets as closely as possible, which is important for multi-class batik recognition under an imbalanced class distribution [3], [32]. A fixed random seed of 42 is used during partitioning to improve experimental reproducibility. The test subset is held out during model development and reserved exclusively for final performance evaluation.
All models are trained using a batch size of 16 for a maximum of 20 epochs with the AdamW optimizer, a learning rate of 0.001, and a weight decay coefficient of 0.0001. These hyperparameters are kept consistent across the evaluated models to establish a shared experimental protocol for comparing their pretrained representations [27], [28]. The validation subset is used to select the linear classifier checkpoint that achieves the highest macro-F1-score. This selection criterion is particularly relevant because the dataset contains unequal numbers of images across the 38 classes, and macro-F1 provides an assessment that gives equal weight to each class rather than allowing majority classes to dominate the evaluation [31]. The held-out test subset is used only for the final evaluation of the selected checkpoint, preventing test-set information from influencing model selection and reducing the risk of information leakage in performance reporting [29]. “‘
3.4 Model Architectures and Training Strategy
The three compared backbones represent distinct paradigms in visual representation learning. ConvNeXt-Tiny is a modern convolutional network that refines ResNet-style designs with ConvNeXt blocks and large kernel convolutions, providing a strong CNN baseline [35]. ViT-B/16 is a supervised Vision Transformer that partitions each image into 16 × 16 patches and uses self-attention to model global dependencies, a design known to perform well on fine-grained visual tasks given suitable pretraining [30] [36]. DINOv2 ViT-B/14 shares a transformer backbone but is pretrained in a self-supervised manner using self-distillation with student–teacher consistency, yielding transferable features that are commonly assessed via linear probing [27] [28]. For each backbone, the pretrained parameters are frozen, and a single linear classification head is added on top of the global image representation. Let denote the backbone mapping a normalized image to a feature vector , and let the linear head be , where , , and is the number of classes. The predicted class probabilities are given by
| (2) |
Here, indexes a class. Training minimizes the categorical cross-entropy loss
| (3) |
where is the number of samples in the batch and is a one-hot target indicator for sample and class . The AdamW optimizer updates only , leaving fixed, so that observed performance differences across ConvNeXt-Tiny, ViT-B/16, and DINOv2 ViT-B/14 can be attributed to their pretrained representations rather than to differences in fine-tuning capacity [27] [37]. This linear probing design directly addresses the identified gap in batik research, where frozen-foundation encoders have rarely been benchmarked under rigorously shared protocols [1].
3.5 Evaluation Metrics and Comparative Analysis
Model performance is quantified on the test set using overall accuracy, macro-precision, macro-recall, and macro-F1-score, reflecting standard practice for multi-class classification problems [31] [38]. Accuracy is computed as
| (4) |
where is the number of test samples, is the true class label, and is the predicted class label. For class , precision and recall are given by
| (5) |
where , , and are the true-positive, false-positive, and false-negative counts for class . Macro-precision and macro-recall are obtained by averaging over all classes:
| (6) |
The macro-F1-score is similarly defined as
| (7) |
Macro-averaging gives equal weight to each class regardless of its support, aligning with the fine-grained nature of the batik dataset and preventing dominant classes from outweighing less frequent ones [31]. Confusion matrices are computed to analyze error structure across the 60 motifs, revealing which patterns are most frequently confused and whether particular architectures better capture subtle differences. Validation learning curves of macro-F1 over epochs and comparative bar plots of accuracy, macro-precision, macro-recall, and macro-F1 across the three models are generated to support a transparent comparative analysis. These visualizations, together with tabulated metrics, identify the strongest-performing backbone under the frozen-feature regime and contextualize performance gaps between ConvNeXt-Tiny, ViT-B/16, and DINOv2 ViT-B/14, acknowledging that any ranking reflects representation quality under linear probing and may differ under full fine-tuning [27].
4 Results
4.1 Overall Test Performance
Across the 38-class Indonesian batik dataset, all three architectures achieved relatively strong performance under the shared linear-probing protocol, with ConvNeXt-Tiny obtaining the highest overall accuracy and macro-F1 on the held-out test set. ConvNeXt-Tiny reached 0.7923 accuracy, 0.6825 macro-precision, 0.6711 macro-recall, and 0.6604 macro-F1. DINOv2 achieved 0.7692 accuracy, 0.6939 macro-precision, 0.6482 macro-recall, and 0.6472 macro-F1, while ViT obtained 0.7538 accuracy, 0.6194 macro-precision, 0.6288 macro-recall, and 0.6161 macro-F1. The ablation summary confirms that ConvNeXt-Tiny attains the best validation macro-F1 (0.6522) and lowest test loss (0.9626), followed by DINOv2 (best validation macro-F1 0.6826, test loss 0.9980) and ViT (0.6151 validation macro-F1, test loss 1.1119). Training times are comparable across models, with differences under 25 seconds, indicating that performance gaps are not due to substantially different computational budgets under the frozen-backbone regime.
4.2 Confusion Matrix Analysis of ConvNeXt-Tiny
The confusion matrix of ConvNeXt-Tiny on the 390 test images shows a dominant main diagonal, consistent with its overall accuracy of 0.7923 and macro-F1 of 0.6604. Three motifs are recognized perfectly (F1 = 1.00): Maluku_Pala, Papua_Tifa, and Sumatera_Utara_Boraspati. Many other motifs also reach F1-scores of at least 0.92, including Corak_Insang, NTB_Lumbung, Papua_Asmat, Yogyakarta_Kawung, Jawa_Barat_Megamendung, Bali_Barong, Kalimantan_Dayak, Lampung_Gajah, and Yogyakarta_Parang. The two largest classes, Kalimantan_Dayak (35 test samples) and Jawa_Barat_Megamendung (32 test samples), are almost entirely classified correctly, with recall of 0.97 each.
Errors are concentrated in classes with few samples and strong visual overlap. Gentongan and Lasem obtain an F1-score of 0.00. For example, the eight Lasem samples are scattered across Priangan, Bali, Ciamis, Madura_Mataketeran, Papua_Cendrawasih, Sumatera_Barat_Rumah_Minang, and Tambal, which indicates that the model has no stable decision boundary for this motif. Bali, Ciamis, and Pekalongan reach F1-scores of only 0.25, 0.25, and 0.22, respectively. Several classes also show a precision–recall imbalance. Betawi has a precision of 1.00 but a recall of 0.25, while Tambal and Priangan attract false positives from other classes, with precision of 0.46 and 0.25, respectively.
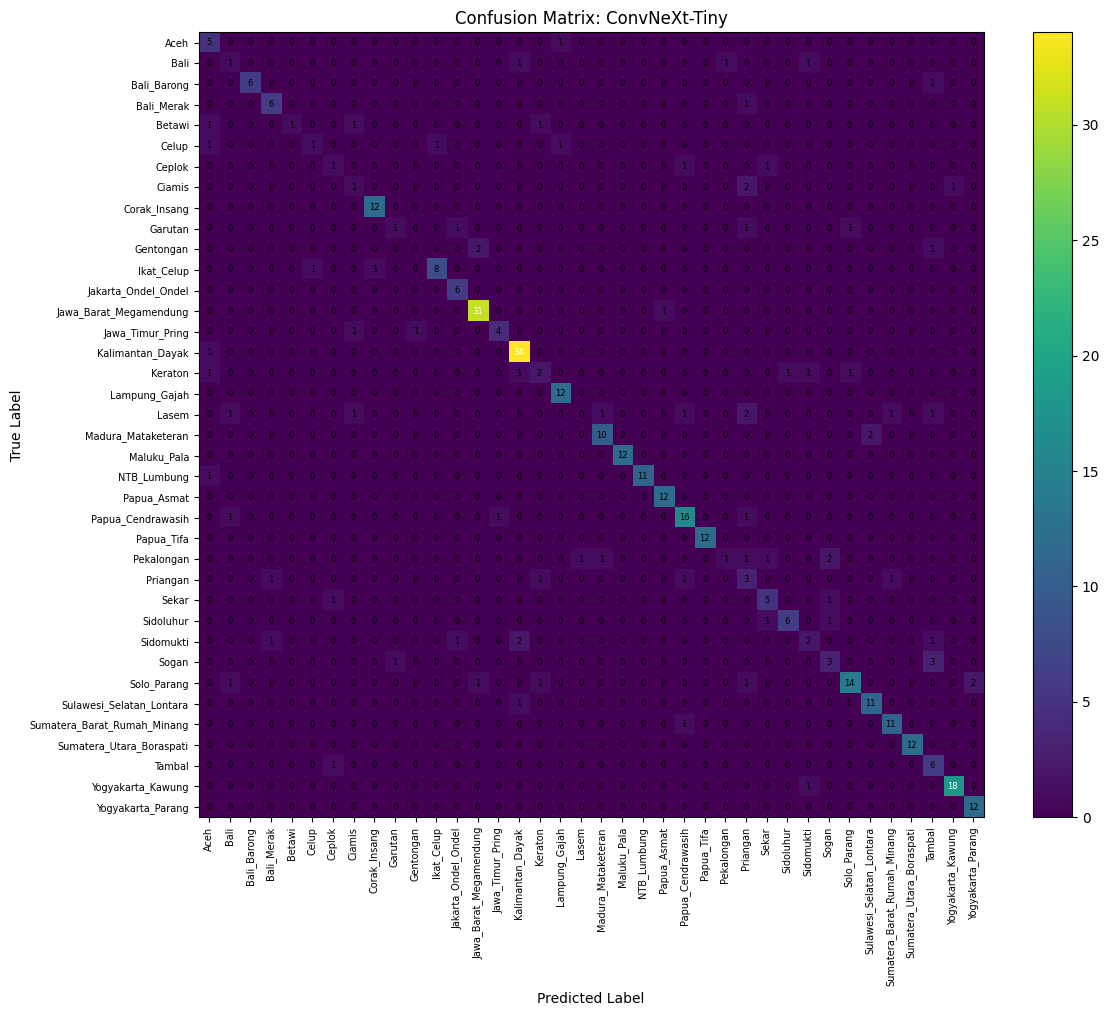
Confusion matrix of ConvNeXt-Tiny on the test set (390 images, 38 batik classes). Rows denote the true labels and columns the predicted labels, and the colour scale indicates the number of samples. The dominant main diagonal shows that most motifs are classified correctly.
4.3 Confusion Matrix Analysis of ViT
The confusion matrix of ViT shows the same overall structure but a weaker diagonal for low-support classes, reflected in the lowest test accuracy (0.7538), macro-F1 (0.6161), and the highest test loss (1.1119) among the three models. Five classes obtain an F1-score of 0.00: Bali, Ceplok, Ciamis, Gentongan, and Lasem. Their samples are absorbed by visually similar classes. For example, the Lasem samples are mostly assigned to Keraton and Pekalongan, and Keraton itself suffers from low precision (0.23) because it collects false positives from many other motifs. Pekalongan, Betawi, and Keraton also remain weak, with F1-scores of 0.29, 0.29, and 0.30.
On the other hand, ViT performs very well on distinctive motifs. Madura_Mataketeran, Maluku_Pala, NTB_Lumbung, Papua_Asmat, Papua_Tifa, and Sumatera_Utara_Boraspati all reach an F1-score of 0.96, and Ikat_Celup (0.91) and Madura_Mataketeran (0.96) are even higher than the corresponding ConvNeXt-Tiny scores (0.84 and 0.83). However, ViT loses clearly on several mid-sized classes, such as Yogyakarta_Kawung (recall 0.74 versus 0.95 for ConvNeXt-Tiny), Papua_Cendrawasih (F1 0.63 versus 0.82), and Sulawesi_Selatan_Lontara (precision 0.62 versus 0.85), which explains its lower aggregate performance.
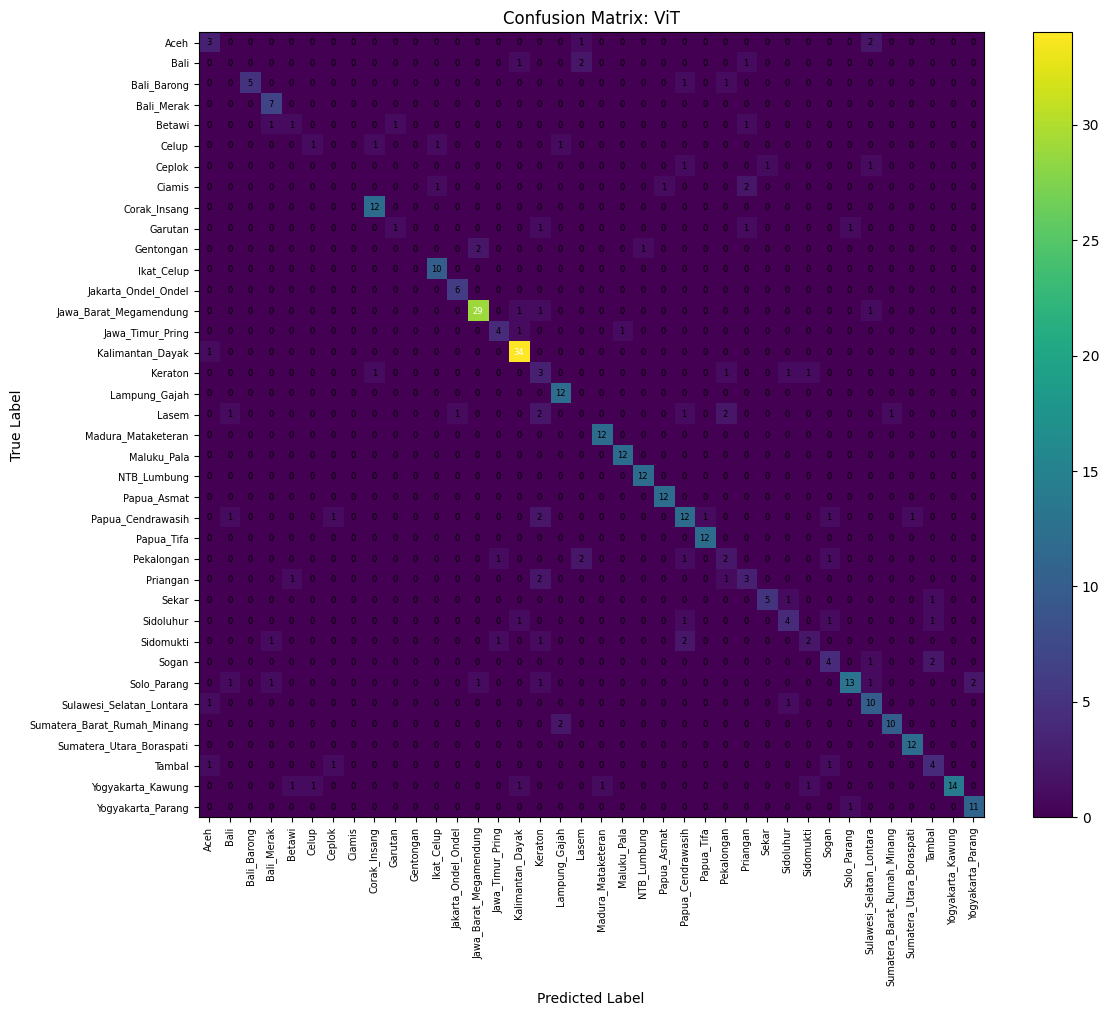
Confusion matrix of ViT on the test set (390 images, 38 batik classes). Rows denote the true labels and columns the predicted labels, and the colour scale indicates the number of samples. Low-support motifs such as Bali, Ceplok, Ciamis, Gentongan and Lasem are not recognized correctly.
4.4 Confusion Matrix Analysis of DINOv2
The confusion matrix of DINOv2 shows a more balanced behavior across classes, with the highest macro precision (0.6939) but a lower accuracy (0.7692) than ConvNeXt-Tiny. Six motifs obtain an F1-score of 1.00: Bali_Barong, Jakarta_Ondel_Ondel, Lampung_Gajah, Madura_Mataketeran, NTB_Lumbung, and Sumatera_Utara_Boraspati. DINOv2 also recovers motifs that ConvNeXt-Tiny misses completely, namely Lasem (F1 0.53 versus 0.00) and Ceplok (F1 0.50 versus 0.33, with a precision of 1.00 but a recall of only 0.33). Nevertheless, Bali, Ciamis, Gentongan, and Pekalongan still obtain an F1-score of 0.00.
A distinctive error pattern appears between the two Parang motifs. Five Yogyakarta_Parang samples are predicted as Solo_Parang, and four Solo_Parang samples are predicted as Yogyakarta_Parang, so the F1-scores of Yogyakarta_Parang and Solo_Parang drop to 0.56 and 0.68, whereas ConvNeXt-Tiny classifies Yogyakarta_Parang with an F1-score of 0.92. Sekar also shows a very low recall (0.29) despite a precision of 1.00, because three of its samples are predicted as Sogan, which in turn has a low precision of 0.25. Overall, DINOv2 improves several mid-frequency classes but is less reliable on visually adjacent motifs, which matches its higher test loss (0.9980) and lower accuracy compared with ConvNeXt-Tiny.
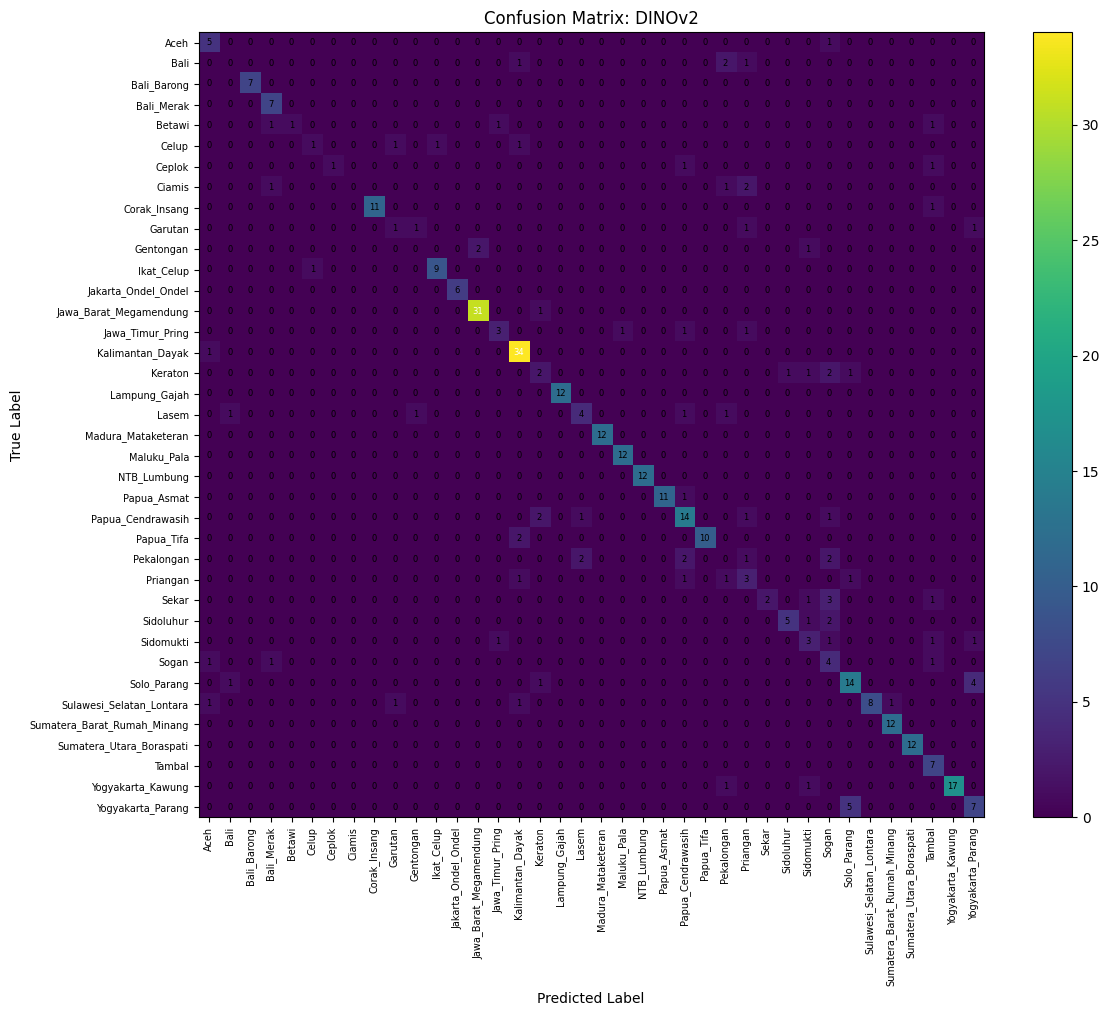
Confusion matrix of DINOv2 on the test set (390 images, 38 batik classes). Rows denote the true labels and columns the predicted labels, and the colour scale indicates the number of samples. Notable confusion occurs between the Yogyakarta Parang and Solo Parang motifs.
4.5 Validation Accuracy Comparison
Validation accuracy trajectories over 20 epochs indicate rapid early learning for all architectures, followed by a saturation phase. ConvNeXt-Tiny improves from 0.6179 to approximately 0.79 by epoch 15 and maintains a consistent advantage over the transformer-based models from epoch 3 onward. DINOv2 starts relatively strong, tracks ConvNeXt-Tiny closely until mid-training, but exhibits more pronounced oscillations and a drop around epochs 15–16 before partially recovering to around 0.77. ViT remains consistently lower, plateauing between 0.73 and 0.75 and never surpassing ConvNeXt-Tiny or DINOv2. The limited accuracy gains after epoch 8 for all models suggest convergence under the linear-probing configuration, with ConvNeXt-Tiny providing the most stable and highest validation accuracy throughout.
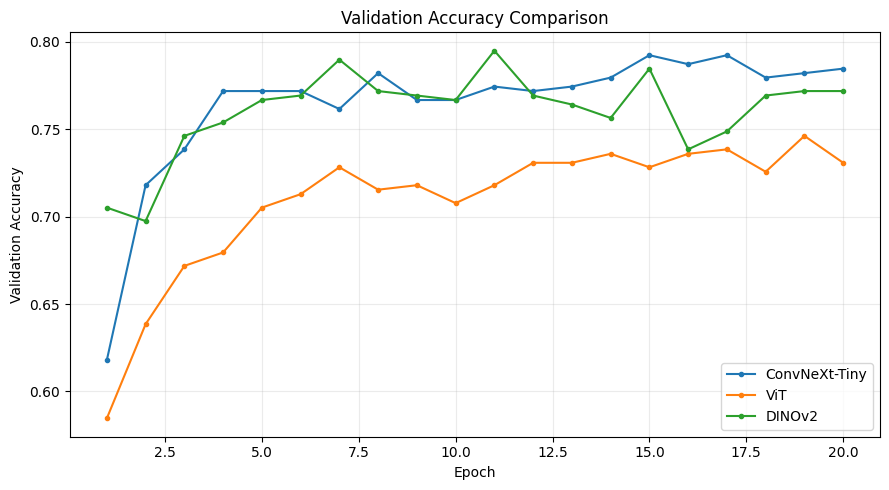
Line chart of validation accuracy across 20 epochs for ConvNeXt-Tiny, ViT and DINOv2.
4.6 Validation Macro-F1 Comparison
Validation macro-F1 curves provide a more class-balanced view of learning. DINOv2 achieves the highest validation macro-F1 throughout training, peaking at approximately 0.683, while ConvNeXt-Tiny peaks near 0.652 and ViT around 0.615. DINOv2’s advantage indicates that its self-supervised features yield more evenly distributed performance across classes, despite slightly lower final accuracy than ConvNeXt-Tiny on the test set. ConvNeXt-Tiny displays rapid early macro-F1 gains (0.448 to around 0.63 by epoch 4) and then slow, stable improvements, whereas ViT’s macro-F1 increases more gradually and plateaus earlier near 0.60–0.62. After epoch 10, all models show only minor fluctuations, with no clear signs of overfitting at the validation level in macro-F1.
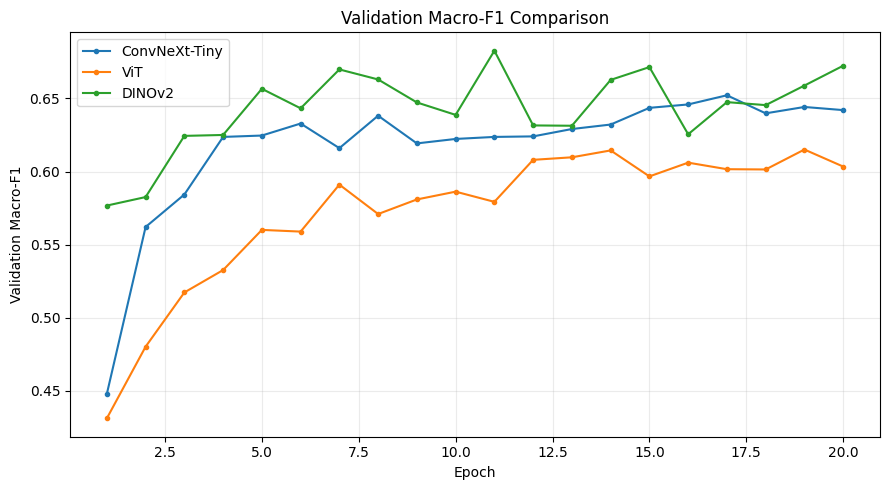
Line chart of validation macro-F1 over 20 epochs for ConvNeXt-Tiny, ViT and DINOv2.
4.7 Validation Loss Comparison
Validation loss curves corroborate the accuracy and macro-F1 findings. ConvNeXt-Tiny attains the lowest and smoothest validation loss, converging to approximately 0.95–0.99 after epoch 8, which aligns with its superior test accuracy and stable confusion matrix. ViT exhibits the highest validation loss, settling around 1.15–1.20, consistent with its lower accuracy and macro-F1. DINOv2 reaches intermediate loss values and displays more variability, with a noticeable spike around epochs 15–16 before partially recovering, reflecting its strong but somewhat less stable class-balanced performance. These trends suggest that under frozen-backbone linear probing, ConvNeXt-Tiny offers the most reliable optimization behavior, while DINOv2 trades slightly higher loss and instability for improved macro-F1 across classes.
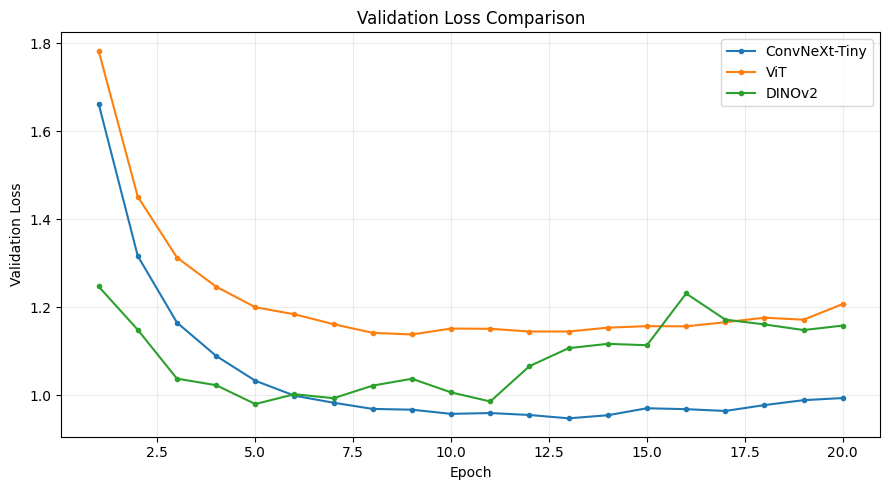
Line chart of validation loss trajectories for ConvNeXt-Tiny, ViT and DINOv2 over 20 epochs.
5 Discussion
The comparative results indicate that modernized convolutional features from ConvNeXt-Tiny transfer particularly well to fine-grained Indonesian batik recognition under a frozen-backbone regime, yielding the highest test accuracy and macro-F1 among the three evaluated architectures. This aligns with findings in decorative-pattern and heritage-like domains where ConvNeXt variants were identified as especially effective at capturing complex local structure in limited-data settings. The strong diagonal dominance in the ConvNeXt-Tiny confusion matrix, especially for texture-rich motifs such as Kalimantan_Dayak and Jawa_Barat_Megamendung, further supports the view that convolutional inductive biases remain advantageous when discriminative cues are concentrated in local ornamentation and stroke-level details [3] [1].
DINOv2’s consistently superior validation macro-F1 but slightly lower test accuracy and higher loss than ConvNeXt-Tiny illustrate an important trade-off. Self-supervised transformer representations appear to better balance performance across classes, particularly mid-frequency motifs with moderate support, consistent with observations that self-distilled ViT backbones often yield strong linear-probe performance across diverse tasks [27] [28]. However, their weaker test accuracy suggests that, in this dataset, DINOv2 sacrifices some peak performance on dominant, more easily separable motifs where ConvNeXt-Tiny excels. This pattern echoes domain-general reviews in medical and fine-grained imaging, which report that transformers can match or surpass CNNs on class-balanced metrics while not always achieving the highest overall accuracy [18] [26] [19].
The supervised ViT-B/16 performs worst across all metrics, despite being trained under the same protocol. This is consistent with prior reports that ViTs often require larger datasets, stronger regularization, or additional architectural biases to fully exploit their global self-attention capabilities, particularly in fine-grained, low-data regimes [9] [12] [30]. In the present batik setting, the patch-based global modeling of ViT-B/16 appears insufficient to fully capture subtle motif variations without further adaptation, leading to failures on several low-support classes and higher validation loss. These findings resonate with earlier batik and heritage studies where purely transformer-based approaches had not yet been systematically evaluated, and where CNN backbones retained a performance advantage [1] [23].
Compared with prior batik-specific work that reports near-perfect or perfect accuracies on 10-class regional datasets using handcrafted features or standard CNNs [3] [1], the present results on a larger, more diverse 38-class corpus show clearly lower absolute performance, even for ConvNeXt-Tiny. This discrepancy underscores prior concerns that earlier protocols may have been overly narrow or optimistic, and that more heterogeneous multi-region datasets expose persistent confusion among visually similar motifs [3] [16]. At the same time, macro-F1 scores around 0.65 demonstrate that modern pretrained encoders, even when frozen, can provide practically useful recognition performance while exposing class-level weaknesses for further refinement.
Several limitations should be acknowledged. First, only the linear heads were trained, so the reported ranking primarily reflects pretrained representation quality rather than full fine-tuning capacity. Prior work suggests that fully fine-tuned ViT or hybrid CNN–ViT models can close or reverse performance gaps in some fine-grained domains [9] [13] [24], and similar gains may emerge for batik motifs. Second, despite covering 38 classes and non-trivial class imbalance, the dataset remains modest relative to large-scale fine-grained benchmarks; this may particularly disadvantage transformers, which are known to benefit from larger training corpora [12] [30]. Third, the analysis is limited to three backbones; alternative ConvNeXt scales, hierarchical transformers (e.g., Swin), or task-specific attention modules could yield different architectural trade-offs [20] [21] [23].
Nevertheless, the study contributes batik-specific evidence that under matched preprocessing and optimization, ConvNeXt-Tiny currently offers the most effective and stable frozen representation for multi-class batik recognition, with DINOv2 providing the best class-balanced validation performance and ViT-B/16 lagging behind. For practical digital-heritage applications such as museum search and mobile motif identification, these findings suggest that modern CNN backbones remain a strong default choice [2] [3], while self-supervised transformers like DINOv2 represent a promising direction for future work emphasizing rare-motif performance, especially when combined with full or partial fine-tuning and more extensive training data.
6 Conclusion
This study systematically compared a modern convolutional architecture (ConvNeXt-Tiny) and two transformer-based models (ViT and DINOv2) for multi-class Indonesian batik pattern recognition across 38 heterogeneous classes. The experimental results demonstrate that ConvNeXt-Tiny achieves the highest overall performance on the test set, with an accuracy of 79.23% and a macro-F1 score of 0.6604, surpassing both ViT and DINOv2 in terms of balanced performance across classes. While DINOv2 attains a slightly higher macro precision and comparable macro-F1 to ConvNeXt-Tiny, its overall accuracy remains lower, and ViT trails both models across most evaluation metrics. These findings indicate that, within the constraints of the available dataset, the ConvNeXt-based convolutional paradigm remains highly competitive and, in this setting, more robust than transformer-based approaches for fine-grained batik classification.
The class-wise analysis further reveals that all models perform strongly on several well-represented and visually distinctive motifs such as Kalimantan Dayak, Jawa Barat Megamendung, Sumatera Utara Boraspati, and Yogyakarta Kawung, often reaching very high precision and recall. Conversely, patterns with fewer samples and subtle intra-class variations, such as Bali, Ceplok, Gentongan, Pekalongan, and some lesser-represented regional motifs, remain challenging, with low or unstable F1 scores across architectures. This underscores the dual impact of class imbalance and visual similarity on model performance and highlights the importance of both data quality and quantity in cultural heritage image recognition tasks.
The main contributions of this work are threefold: it provides a curated, multi-class benchmark of 38 Indonesian batik categories with realistic class imbalance; it offers a rigorous, side-by-side comparison of ConvNeXt and transformer-based models under identical training and evaluation protocols; and it delivers actionable insights into which model families are currently best suited for operational batik recognition systems. Nevertheless, the study is limited by the relatively modest dataset size, the lack of explicit imbalance-handling strategies, and the reliance on single backbones per architectural family without exhaustive hyperparameter exploration.
Future research should focus on collecting larger and more balanced batik datasets, exploring advanced augmentation and class-rebalancing techniques, and investigating hybrid or lightweight architectures that combine convolutional inductive biases with transformer-style global context. Further work could also incorporate multi-task learning that couples pattern recognition with region-of-origin or era prediction, and evaluate model robustness in real-world deployment settings, including mobile and on-device applications to support education, cultural preservation, and creative industries.
References
- [1] E. Winarno, A. Solichan, A. Putra Ramdani, W. Hadikurniawati, A. Septiarini, and H. Hamdani, “Enhanced Semarang batik classification using deep learning: a comparative study of CNN architectures,” Bulletin EEI, vol. 14, no. 5, pp. 3544–3557, Oct. 2025. doi: 10.11591/eei.v14i5.9347.
- [2] R. Rosalina, G. Sahuri, and H. Desriva, “A mobile-optimized convolutional neural network approach for real-time batik pattern recognition,” IJ-AI, vol. 13, no. 3, pp. 3018–3027, Sep. 2024. doi: 10.11591/ijai.v13.i3.pp3018-3027.
- [3] E. Winarno, A. Septiarini, W. Hadikurniawati, and H. Hamdani, “The Hybrid Features and Supervised Learning for Batik Pattern Classification,” J. Comput. Cult. Herit., vol. 17, no. 2, pp. 1–13, June 2023. doi: 10.1145/3631131.
- [4] Y. Liu, H. Zhang, X. Che, W. Zhang, and G. Lu, “Deep Learning Based Fine‐Grained Image Classification: Recent Advances, Applications and Future Outlook,” IET Image Processing, vol. 19, no. 1, p. e70243, Jan. 2025. doi: 10.1049/ipr2.70243.
- [5] B. Ma, Z. Jin, J. Li, J. Li, P. Zhang, X. Song, and B. Jin, “Token Injection Transformer for Enhanced Fine-Grained Recognition,” Processes, vol. 14, no. 3, p. 492, Jan. 2026. doi: 10.3390/pr14030492.
- [6] D. Revikumar, A. P. Byju, and L. Bruzzone, “Saliency-Guided Feature Mining Network for Multi-Scale Fine-Grained Scene Classification in Remote Sensing Image Archives,” IEEE Geosci. Remote Sensing Lett., vol. 23, pp. 1–5, 2026. doi: 10.1109/lgrs.2025.3631832.
- [7] AlMajed et al., “Entropy-Based Ensemble of Convolutional Neural Networks for Clothes Texture Pattern Recognition,” 2024.
- [8] Q. Pan, K. Liu, S. Zheng, and G. Wang, “A Fine-Grained Image Classification Method Based on ConvNeXt Heatmap Localization and Contrastive Learning,” IEEE Access, vol. 13, pp. 80123–80132, 2025. doi: 10.1109/access.2025.3567488.
- [9] G. Wang, H. Chen, L. Chen, Y. Zhuang, S. Zhang, T. Zhang, H. Dong, and P. Gao, “P2FEViT: Plug-and-Play CNN Feature Embedded Hybrid Vision Transformer for Remote Sensing Image Classification,” Remote Sensing, vol. 15, no. 7, p. 1773, Mar. 2023. doi: 10.3390/rs15071773.
- [10] L. Wei, Z. Chang, J. Li, J. Cai, and X. Peng, “FRAM-ViT: Frequency-Aware and Relation-Enhanced Vision Transformer with Adaptive Margin Contrastive Center Loss for Fine-Grained Classification of Ancient Murals,” Electronics, vol. 15, no. 2, p. 488, Jan. 2026. doi: 10.3390/electronics15020488.
- [11] Z. Li, T. Gu, B. Li, W. Xu, X. He, and X. Hui, “ConvNeXt-Based Fine-Grained Image Classification and Bilinear Attention Mechanism Model,” Applied Sciences, vol. 12, no. 18, p. 9016, Sep. 2022. doi: 10.3390/app12189016.
- [12] G. J. Ferdous, K. A. Sathi, M. A. Hossain, M. M. Hoque, and M. A. A. Dewan, “LCDEiT: A Linear Complexity Data-Efficient Image Transformer for MRI Brain Tumor Classification,” IEEE Access, vol. 11, pp. 20337–20350, 2023. doi: 10.1109/access.2023.3244228.
- [13] T. Zhang, W. Xu, B. Luo, and G. Wang, “Depth-Wise Convolutions in Vision Transformers for efficient training on small datasets,” Neurocomputing, vol. 617, p. 128998, Feb. 2024. doi: 10.1016/j.neucom.2024.128998.
- [14] E. R. Swedia, A. Darmayantie, M. A. Marwan, and A. Muslim, “A Colorfulness-Stratified Diagnostic of Color Reliance in Convolutional and Attention Models for Fine-Grained Classification,” IEEE Access, vol. 14, pp. 129361–129373, 2026. doi: 10.1109/access.2026.3725483.
- [15] D. A. Anggoro, A. A. T. Marzuki, and W. Supriyanti, “Classification of Solo Batik patterns using deep learning convolutional neural networks algorithm,” TELKOMNIKA, vol. 22, no. 1, p. 232, Aug. 2023. doi: 10.12928/telkomnika.v22i1.24598.
- [16] M. A. Rasyidi, R. Handayani, and F. Aziz, “Identification of batik making method from images using convolutional neural network with limited amount of data,” Bulletin EEI, vol. 10, no. 3, pp. 1300–1307, June 2021. doi: 10.11591/eei.v10i3.3035.
- [17] Z. Widyantoko, T. Purwati Widowati, I. Isnaini, and P. Trapsiladi, “Expert role in image classification using CNN for hard to identify object: distinguishing batik and its imitation,” IJ-AI, vol. 10, no. 1, pp. 93–100, Mar. 2021. doi: 10.11591/ijai.v10.i1.pp93-100.
- [18] Y. Lee, S. Lee, and S. Hwang, “Patch-Level Consistency Regularization in Self-Supervised Transfer Learning for Fine-Grained Image Recognition,” Applied Sciences, vol. 13, no. 18, p. 10493, Sep. 2023. doi: 10.3390/app131810493.
- [19] M. M. H. Melon, S. R. Kazi, R. Uddin, H. Ahmed, D. Biswas, Y. Khan, and R. Keneni, “Attention-guided fusion of swin transformer and DINOv2 features for peripheral blood cell classification across eight classes,” Discov Artif Intell, vol. 6, no. 1, p. 502, Apr. 2026. doi: 10.1007/s44163-026-01211-5.
- [20] A. R. W. Sait and Y. Alkhurayyif, “A Novel Hybrid CNN-ViT-Based Bi-Directional Cross-Guidance Fusion-Driven Breast Cancer Detection Model,” Life, vol. 16, no. 3, p. 474, Mar. 2026. doi: 10.3390/life16030474.
- [21] M. F. Kabir, R. Uddin, S. K. R. U. I. Rahat, Y. Arafat, A. Sobur, and C. Wata, “TriGWONet a lightweight multibranch convolutional neural network using gray wolf optimization for accurate oral cancer image classification,” Discov Artif Intell, vol. 6, no. 1, p. 91, Jan. 2026. doi: 10.1007/s44163-025-00776-x.
- [22] B. Madhavi, M. Mahanty, C.-C. Lin, B. O. Lakshmi Jagan, H. M. Rai, S. Agarwal, and N. Agarwal, “SwinConvNeXt: a fused deep learning architecture for Real-time garbage image classification,” Sci Rep, vol. 15, no. 1, p. 7995, Mar. 2025. doi: 10.1038/s41598-025-91302-7.
- [23] J. Zhou, L. Xie, P. Fricker, and K. Liu, “ConvNeXt-L-Based Recognition of Decorative Patterns in Historical Architecture: A Case Study of Macau,” Buildings, vol. 15, no. 20, p. 3705, Oct. 2025. doi: 10.3390/buildings15203705.
- [24] Y. Bazi, L. Bashmal, M. M. A. Rahhal, R. A. Dayil, and N. A. Ajlan, “Vision Transformers for Remote Sensing Image Classification,” Remote Sensing, vol. 13, no. 3, p. 516, Feb. 2021. doi: 10.3390/rs13030516.
- [25] R. Missaoui, M. Del Coco, W. Saadaoui, W. Hechkel, A. Helali, P. Carcagnì, and M. Leo, “Brain Tumor Classification Using DINO Features and Lightweight Classifiers,” Electronics, vol. 15, no. 5, p. 952, Feb. 2026. doi: 10.3390/electronics15050952.
- [26] S. Takahashi, Y. Sakaguchi, N. Kouno, K. Takasawa, K. Ishizu, Y. Akagi, R. Aoyama, N. Teraya, A. Bolatkan, N. Shinkai, H. Machino, K. Kobayashi, K. Asada, M. Komatsu, S. Kaneko, M. Sugiyama, and R. Hamamoto, “Comparison of Vision Transformers and Convolutional Neural Networks in Medical Image Analysis: A Systematic Review,” J Med Syst, vol. 48, no. 1, p. 84, Sep. 2024. doi: 10.1007/s10916-024-02105-8.
- [27] M. Marks, M. Knott, N. Kondapaneni, E. Cole, T. Defraeye, F. Perez-Cruz, and P. Perona, “A Closer Look at Benchmarking Self-supervised Pre-training with Image Classification,” Int J Comput Vis, vol. 133, no. 8, pp. 5013–5025, Aug. 2024. doi: 10.1007/s11263-025-02402-w.
- [28] A. Abedi, Q. M. J. Wu, N. Zhang, and F. Pourpanah, “Efficient Unsupervised Domain Adaptation via Self-Supervised Vision Transformer and Synergistic Cross-Domain Alignment,” Oct. 2024. doi: 10.21203/rs.3.rs-7653038/v1.
- [29] S. Tayebi Arasteh, M. Shaigan, C. Kuhl, J. N. Kather, S. Nebelung, and D. Truhn, “Resolution-dependent self-supervised transfer in chest radiograph classification,” Commun Med, vol. 6, no. 1, p. 479, Sep. 2025. doi: 10.1038/s43856-026-01897-9.
- [30] A. U. Khan, G. Ramasamy, M. D. Khan, J. Garrett, T. Bradshaw, L. Salkowski, and I. Banerjee, “On the transfer learning behavior of domain-specific vision–language models in screening mammography,” Journal of Biomedical Informatics, vol. 175, p. 104986, Mar. 2026. doi: 10.1016/j.jbi.2026.104986.
- [31] L. Elvitaria, E. F. A. Shaubari, N. A. Samsudin, S. K. A. Khalid, S. -, and Z. Indra, “A Proposed Batik Automatic Classification System Based on Ensemble Deep Learning and GLCM Feature Extraction Method,” ijacsa, vol. 15, no. 10, 2024. doi: 10.14569/ijacsa.2024.0151058.
- [32] A. E. Minarno, I. Soesanti, and H. A. Nugroho, “Batik Nitik 960 Dataset for Classification, Retrieval, and Generator,” Data, vol. 8, no. 4, p. 63, Mar. 2023. doi: 10.3390/data8040063.
- [33] E. Conti, R. Rosati, L. Federici, A. Mancini, and M. C. Fiorentino, “Challenging DINOv3 foundation model under low inter-class variability: a case study on fetal brain ultrasound,” Neural Comput & Applic, vol. 38, no. 12, p. 487, June 2025. doi: 10.1007/s00521-026-12210-z.
- [34] S. Suprapto, M. N. Tentua, and A. R. Maulana, “Optimizing nitik batik classification through comparative analysis of image augmentation,” Int J Artif Intell, vol. 14, no. 5, pp. 3970–3981, Oct. 2025. doi: 10.11591/ijai.v14.i5.pp3970-3981.
- [35] M. Springenberg, A. Frommholz, M. Wenzel, E. Weicken, J. Ma, and N. Strodthoff, “From modern CNNs to vision transformers: Assessing the performance, robustness, and classification strategies of deep learning models in histopathology,” Medical Image Analysis, vol. 87, p. 102809, July 2022. doi: 10.1016/j.media.2023.102809.
- [36] Y. Wang, Y. Deng, Y. Zheng, P. Chattopadhyay, and L. Wang, “Vision Transformers for Image Classification: A Comparative Survey,” Technologies, vol. 13, no. 1, p. 32, Jan. 2025. doi: 10.3390/technologies13010032.
- [37] X. Tang, X. Yue, H. Mane, D. Smolyak, D. Li, Q. Nguyen, and T. Tasdizen, “Robust and Scalable Representation Learning for Google Street View–Based Neighborhood Indicators,” 2026. doi: 10.2139/ssrn.6458421.
- [38] E. Saeed, “A baseline study of rare-phase detection in ultra-high carbon steel microstructures using deep learning and handcrafted texture features,” J. Mater. Sci.: Metall., vol. 1, no. 1, p. 12, July 2026. doi: 10.1007/s44492-026-00012-2.